

February 2016 – Volume 19, Number 4
| Title | Piktochart |
| Author | Piktochart.com |
| Contact Information | http://piktochart.com
YouTube tutorials: Top 5 tricks you did not know you could do with Piktochart |
| Type of Product | Graphic design program used to create infographics, reports, posters and presentations |
| Platform | Web-based |
| Current Compatibility | The website claims that the site works best on Chrome and Firefox because Piktochart needs Javascript. Other popular browsers may or may not function as well.
Piktochart has an app that is iPhone/iPad compatible, but users can only access the images they have previously created on a computer. The website promises full functionality on mobile devices shortly. |
| Registration | Required |
| Price | Free: Many of the templates are available for no charge. Users can upgrade to Lite (US$15 per month) or Pro (US$29 per month). There are also non-profit and educator plans. There are two educator plans: Individual PRO which provides 12 months for US$39.99 or Classroom PRO which provides 30 accounts for 4 months for US$120. |
Introduction
Piktochart is a website that is used to create four styles of web-based graphics: reports, presentations, posters and info-graphics. This review will focus on info-graphics, or visual images that represent often lengthy or complex data. This style of delivering information is ubiquitous on the web and a favorite of designers who wish to give more information than can be included on a poster, but still wish to use a visual medium. The following review will give an overview of how to create an info-graphic using Piktochart and then offer a specific pedagogical application of the software entailing a no-prep activity that not only promotes reading comprehension and critical thinking skills, but also gives students practice in using graphic design and computer skills.
General Description
Overview
Piktochart was created in 2012 and marketed as an intuitive tool that makes graphic design available to novice designers. Piktochart can be used to create four types of web-based, ready-to-publish graphics: reports, presentations, posters and info-graphics. After registering with the system, users who chose the free option have access to over 200 free graphical templates and can access all the essential elements of graphic design including creating, editing, saving, downloading, publishing, and sharing. Users have the option to upgrade from the free version to remove the Piktochart watermark, create PDF files, use higher resolution images, and gain access to hundreds more templates. While the website targets business marketers, it is also invaluable for educators. Currently, Piktochart has approximately 600,000 users.
Structure
The Piktochart home page shows the four types of graphics that can be made. Once users select which format they want to use, they are given a menu of templates specific to that type of document. Several free templates are shown first, and users can scroll down to see the many more templates that are accessible to paying customers.
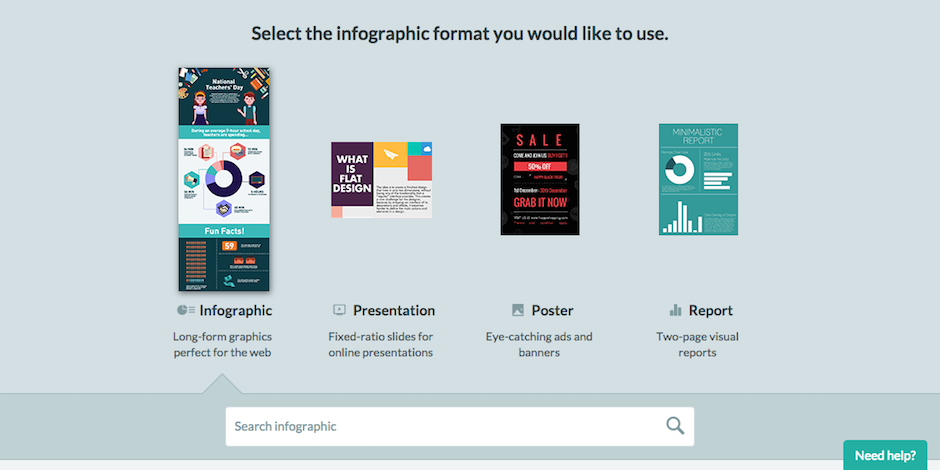
Figure 1. Piktochart homepage prompting selection of a document type
Once a document type is selected, users may hover the arrow over a template example to see two options: Preview and Create. Users can then click Preview to enlarge the template, and click Create to start editing.
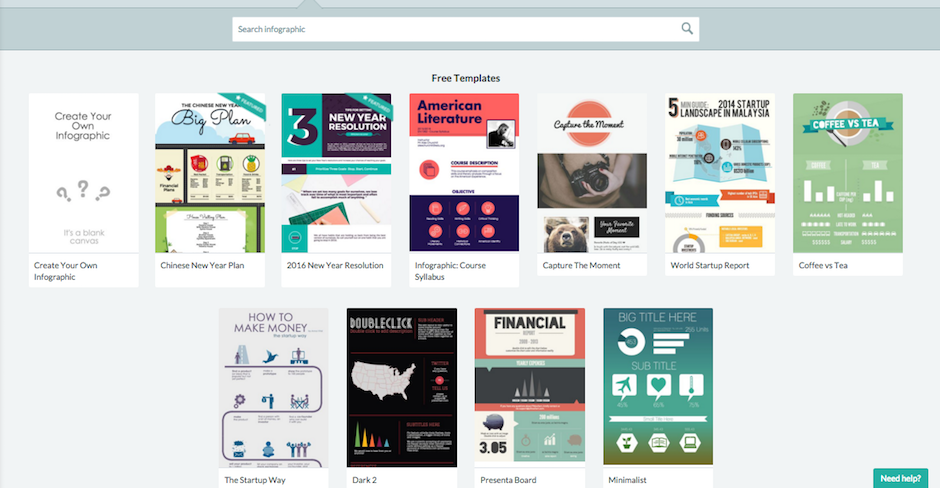
Figure 2. Piktochart cuing selection of a document template
Creating and editing is straightforward. Since the editing features are very similar to those used in standard word processing programs, most users will be familiar with them. In addition, Piktochart’s icons are clear. It is simple to drag and drop pictures, re-size text, move blocks, or change the colors of templates, for example. The graphics change as the arrow hovers over different choices, so there is no need to click or undo unnecessarily. The program even responds to keyboard shortcuts. If users are confused, the help button is always handy in the lower right-hand corner of the screen.
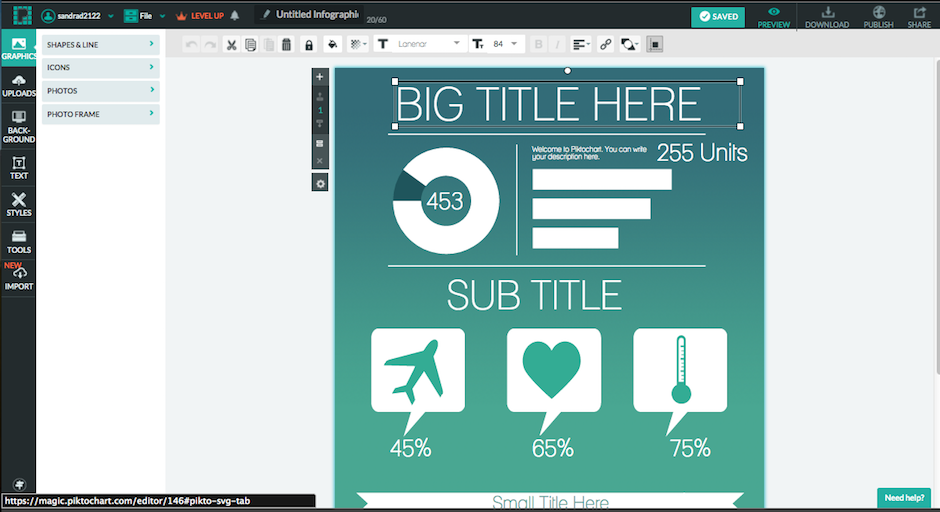
Figure 3. Piktochart page allowing creation of the document
Users can preview their document at anytime, as seen in this example of a work in progress. In this image, a student has begun to add their ideas, while the bottom of the document has not yet been changed.

Figure 4. Piktochart preview of the created document
When finished, users may choose to download (see Figure 5), publish (see Figure 6), and/or share (see Figure 7) their work. The free version allows users only to download the document as an image (.png format). As mentioned earlier, users must upgrade to remove the watermark or to download the document as a PDF file. It may be possible, however, to create a PDF by exporting the document once it has been downloaded to the computer. It is important to keep in mind that these graphics are web-based and intended for use on the Internet (with the exception of the poster option). Especially with info-graphics, the goal is not to create a printed copy. Indeed, printed copies are often costly and less impactful.
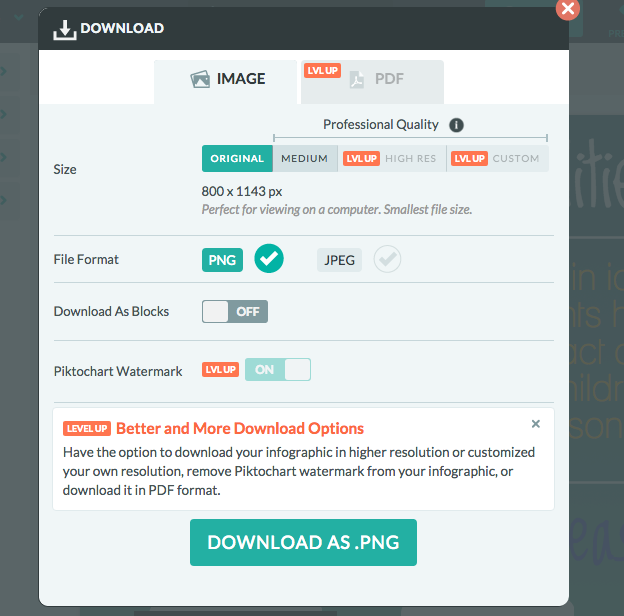
Figure 5. Piktochart’s download option
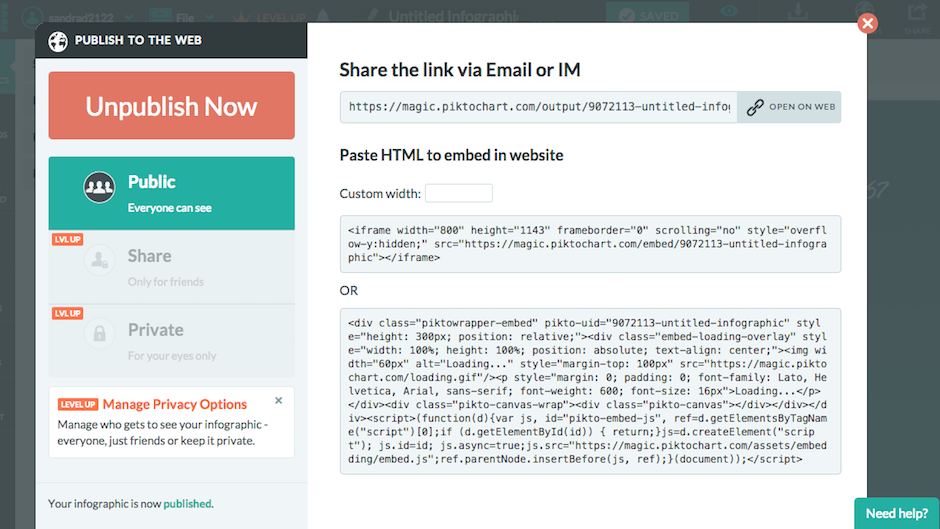
Figure 6. Piktochart’s publish option

Figure 7. Piktochart’s share option
Evaluation
Cost and Accessibility
The price is right. Students can accomplish classroom goals described in this review by using the free version of this software. Most students recognize the icons and editing tools, as they are common to widely used software packages, so they tend to have no trouble using the website. This means that, generally, students are able to go right to the cognitive tasks at hand. Sharing the results of their learning is also easy and intuitive.
Teaching/Learning Value
Imagine that your student-learning outcome is to identify main ideas and supporting details in a written text. In a standard reading task, students often show comprehension by completing a set of reading comprehension questions. This is a reasonable, albeit basic, activity. However, by supplementing the activity with the incorporation of info-graphics, the requirement for critical thinking will increase considerably.
In the example scenario, after reading a text, the students could work with a partner using Piktochart to create an info-graphic that visually represents the passage’s main idea and supporting details, as well as provide short paraphrased labels; by accomplishing this activity, students are required to use a multitude of higher-order thinking skills (Churches, 2008). They analyze as they summarize the main idea and supporting details into short, paraphrased text and then determine which template best reflects the text’s structure (compare/contrast? descriptive?). Students then must evaluate as they discuss, debate, draw conclusions about, and negotiate their ideas regarding the design of their info-chart. They also create as they imagine, edit, and produce their graphic. The project provides a meaningful reason to read and re-read, as students continually refer back to the text to support their ideas. Throughout task completion, the students are practicing their academic English skills, as the content of the text provides the basis of the conversation.
In addition, students learn web skills that are increasingly crucial, as information is delivered in more and more visual ways on the Internet. Most language learning lessons that utilize info-graphics address how to help students understand the information that is given in existing documents. This example of a no-prep lesson goes further than traditional reading comprehension activities in that students will inevitably learn about comprehending graphic documents in the process of creating one. The activity is an experiential, hands-on comprehension task that requires almost no preparation at all.
Target Use
In terms of education, target users of this website could be English instructors and their students. Creating web-based visuals offer both linguistic and cognitive benefits for English learners. Essentially, the integration of info-graphics, especially effective in conveying large or complex amounts of data in a concise way, provides another mode of communication. Additionally, the creation of a visual document is not as easy as it looks. The many decisions involved in a visual’s design provide real-world opportunities to negotiate language on multiple levels. English language instructors will appreciate the cognitive challenge provided to students, as well. Language learners of all levels can benefit from representing what they know in a picture and then labeling the visual with written language. The possibilities for classroom instruction are endless, since info-graphics can be integrated into reading, writing, listening, and speaking lessons.
A few words of caution: Piktochart allows users to upload pictures from a personal device or to drag and drop online images. Students should be taught “netiquette” around copyright issues and the appropriate use of images online.
Summary
Piktochart is a free website that is easy to access and easy to use. It offers the ability to create four styles of documents, with the info-graphic as the most useful for teachers of English. The classroom instruction possibilities abound. It should be kept in mind that the documents are intended to be viewed online and may not result in usable printed-paper copies. The creators have announced that a mobile version will be offered soon, and this will only increase Piktochart’s utility.
References
Churches, A. (2008). Bloom’s taxonomy blooms digitally. Teachnology. Retrieved from http://teachnology.pbworks.com/f/Bloom%5C’s+Taxonomy+Blooms+Digitally.pdf
About the Reviewer
Sandra Clark <sandrac uoregon.edu> is an instructor in the University of Oregon’s American English Institute. Her current interests include professional development, academic writing, environmental stewardship, and generational differences among English learners.
|
© Copyright rests with authors. Please cite TESL-EJ appropriately.
Editor’s Note: The HTML version contains no page numbers. Please use the PDF version of this article for citations. |